Stop Staring at Red and Green. Start Seeing the Heat.
Standard candles only tell you where the price started and ended. They are silent. Crazy Hot Candles are loud. Using Neon Tube Physics and a Kinetic Thermal Scan, this system visualizes the internal pressure of every candle. It translates raw volume, relative volatility, and institutional displacement into a color-coded "Crayon Palette" that reveals the true intent of the market.
⚠️ CRITICAL TRADINGVIEW SETUP (DO THIS FIRST)
To get the true "Heat Map" look, you must adjust your native TradingView candle settings. If you skip this step, TradingView’s default colors will bleed through and ruin the thermal visuals.
- Open your TradingView chart.
- Double-click on any standard candle (or click the Gear icon ⚙️ to open Chart Settings).
- Navigate to the Symbol tab.
- UNCHECK the "Borders" box.
- UNCHECK the "Wicks" box.
- Click OK.
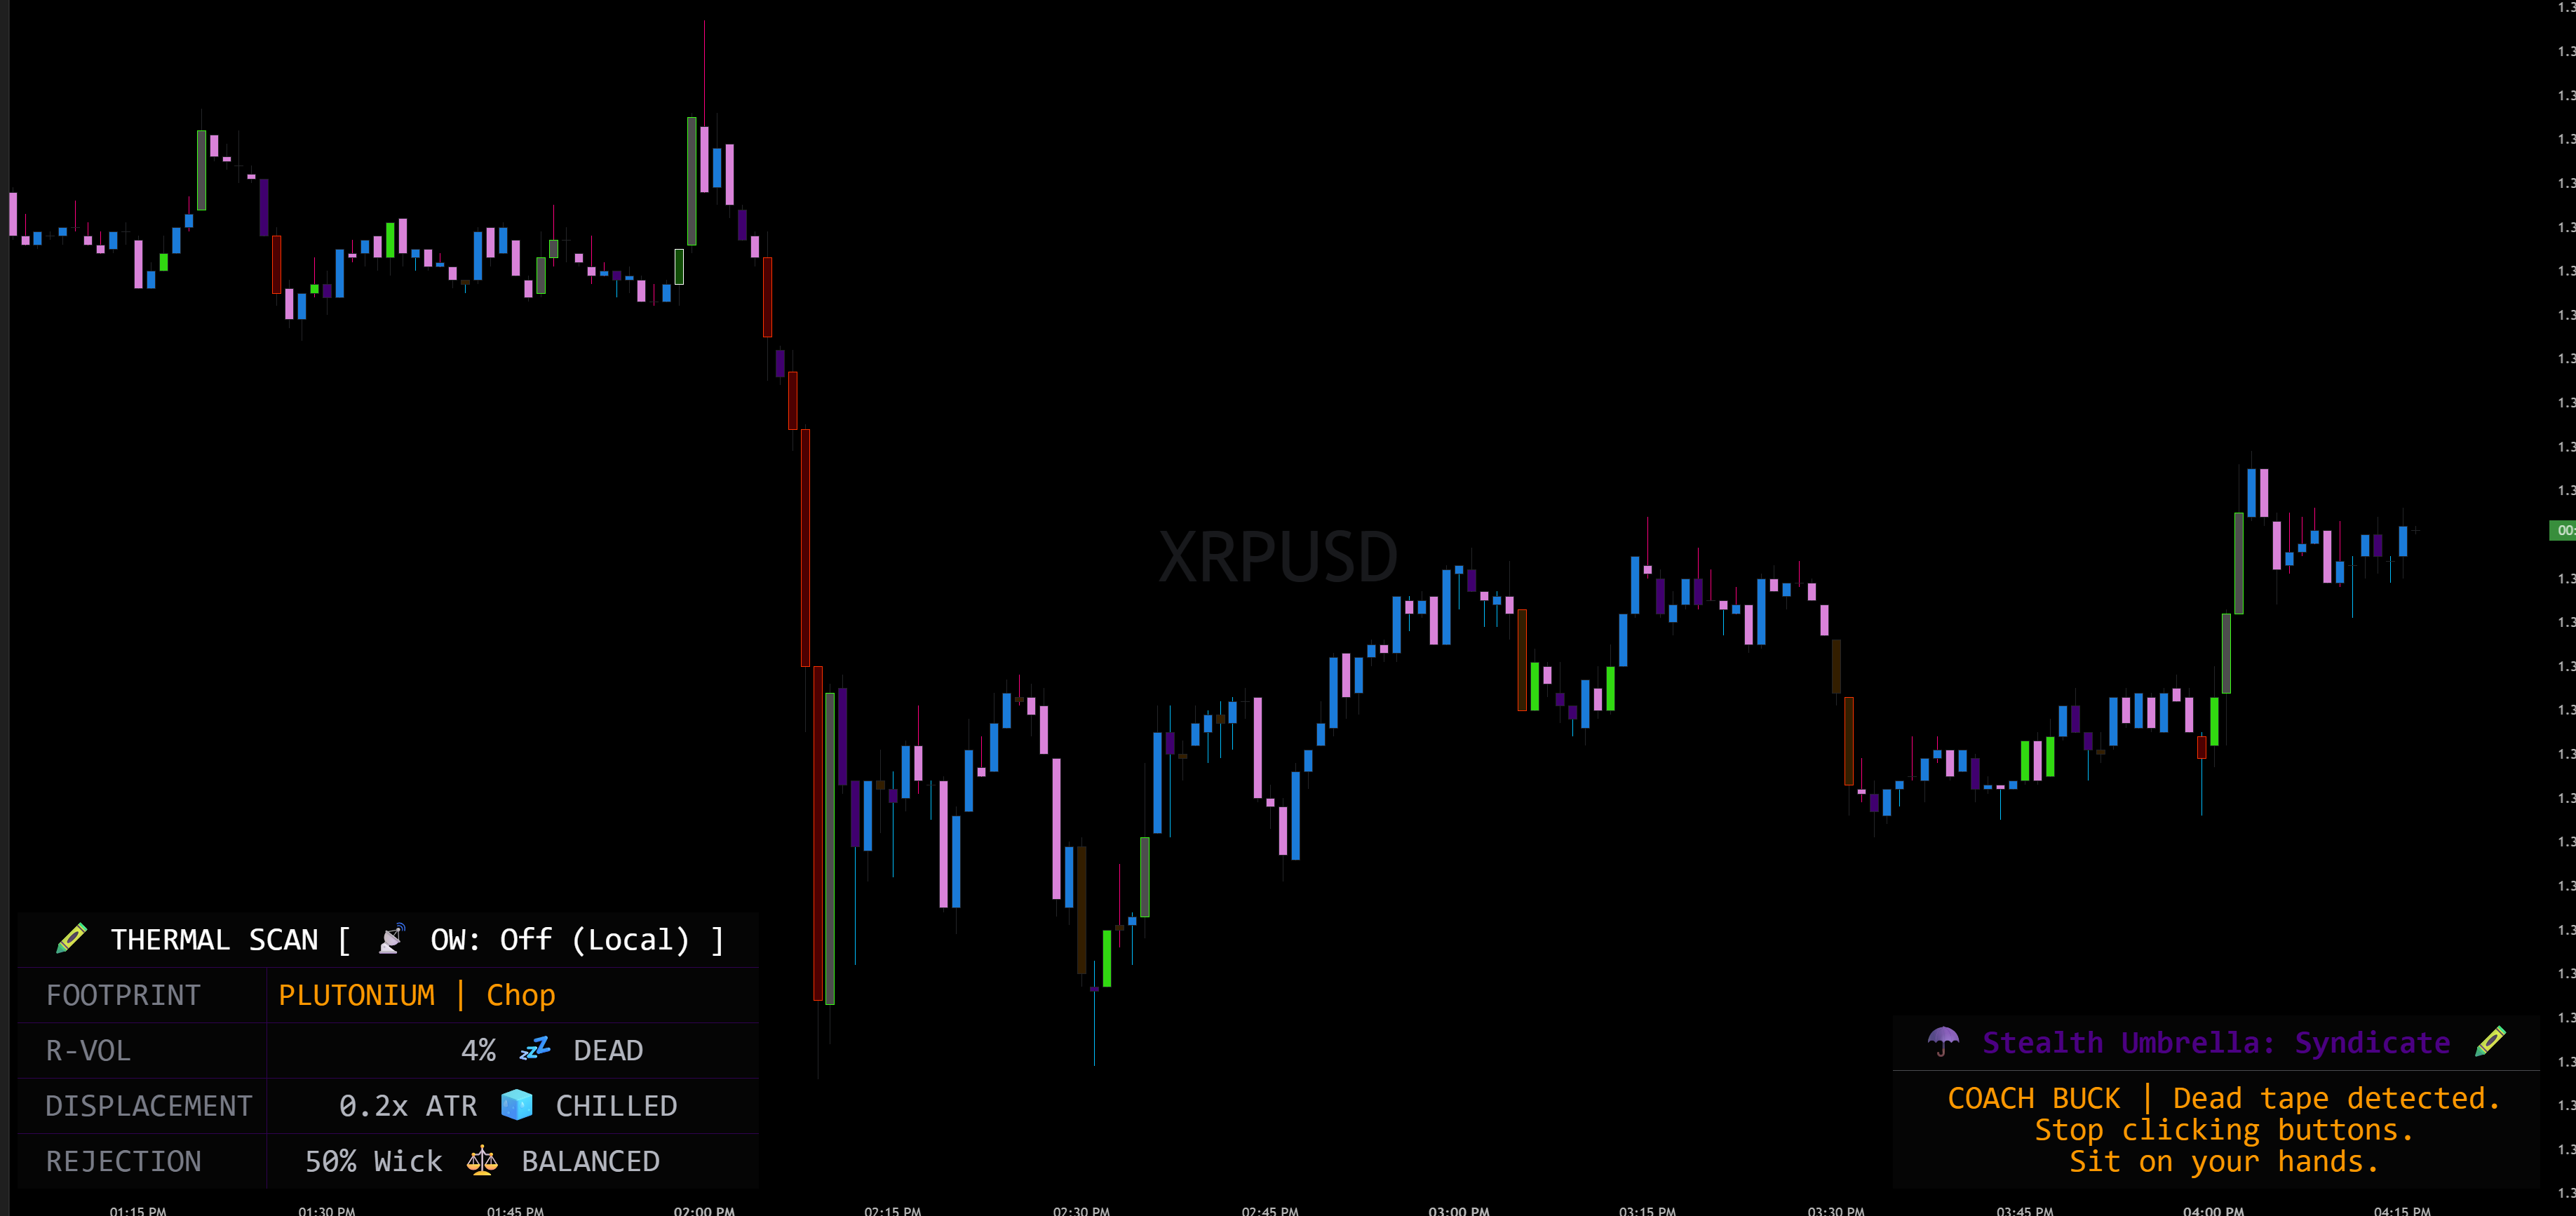
📡 The Overwatch Radar: HTF Siphon
The most powerful feature of this system is the Overwatch Radar. In the settings, you can "Siphon" data from a higher timeframe (5m, 15m, 1H, etc.) and project it directly onto your current chart.
If you are scalping the 1-minute chart, your candles will change color based on what the 15-minute institutional money is doing. This allows you to stay in winning trades longer and avoid "fake-out" moves that lack macro backing.
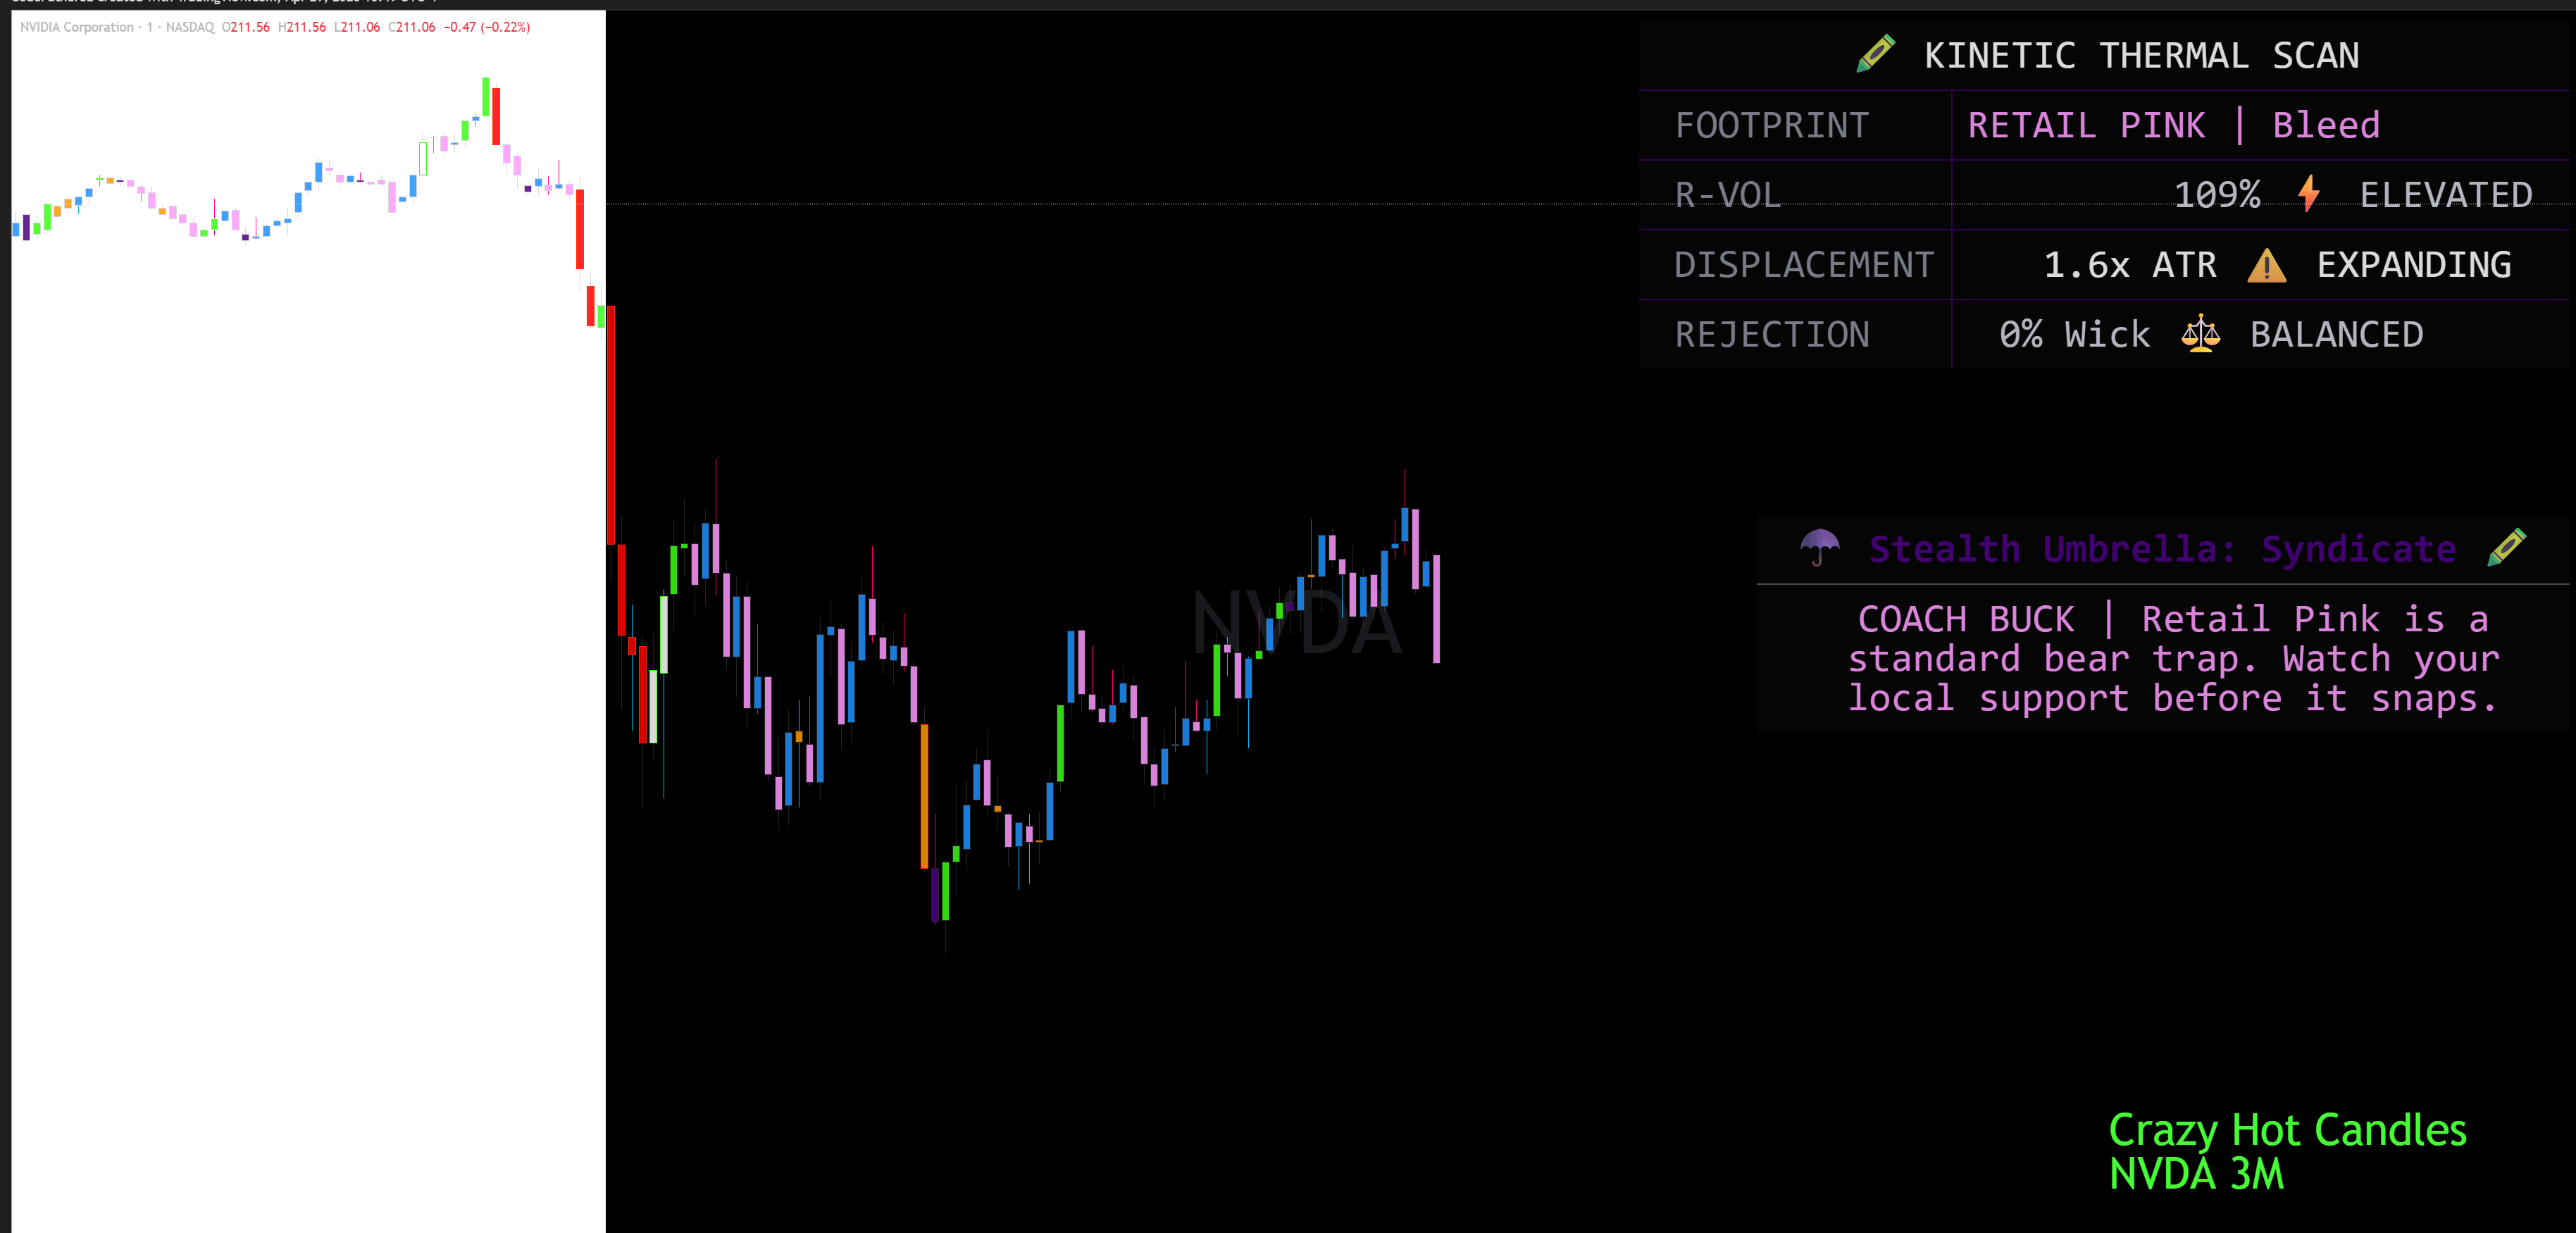
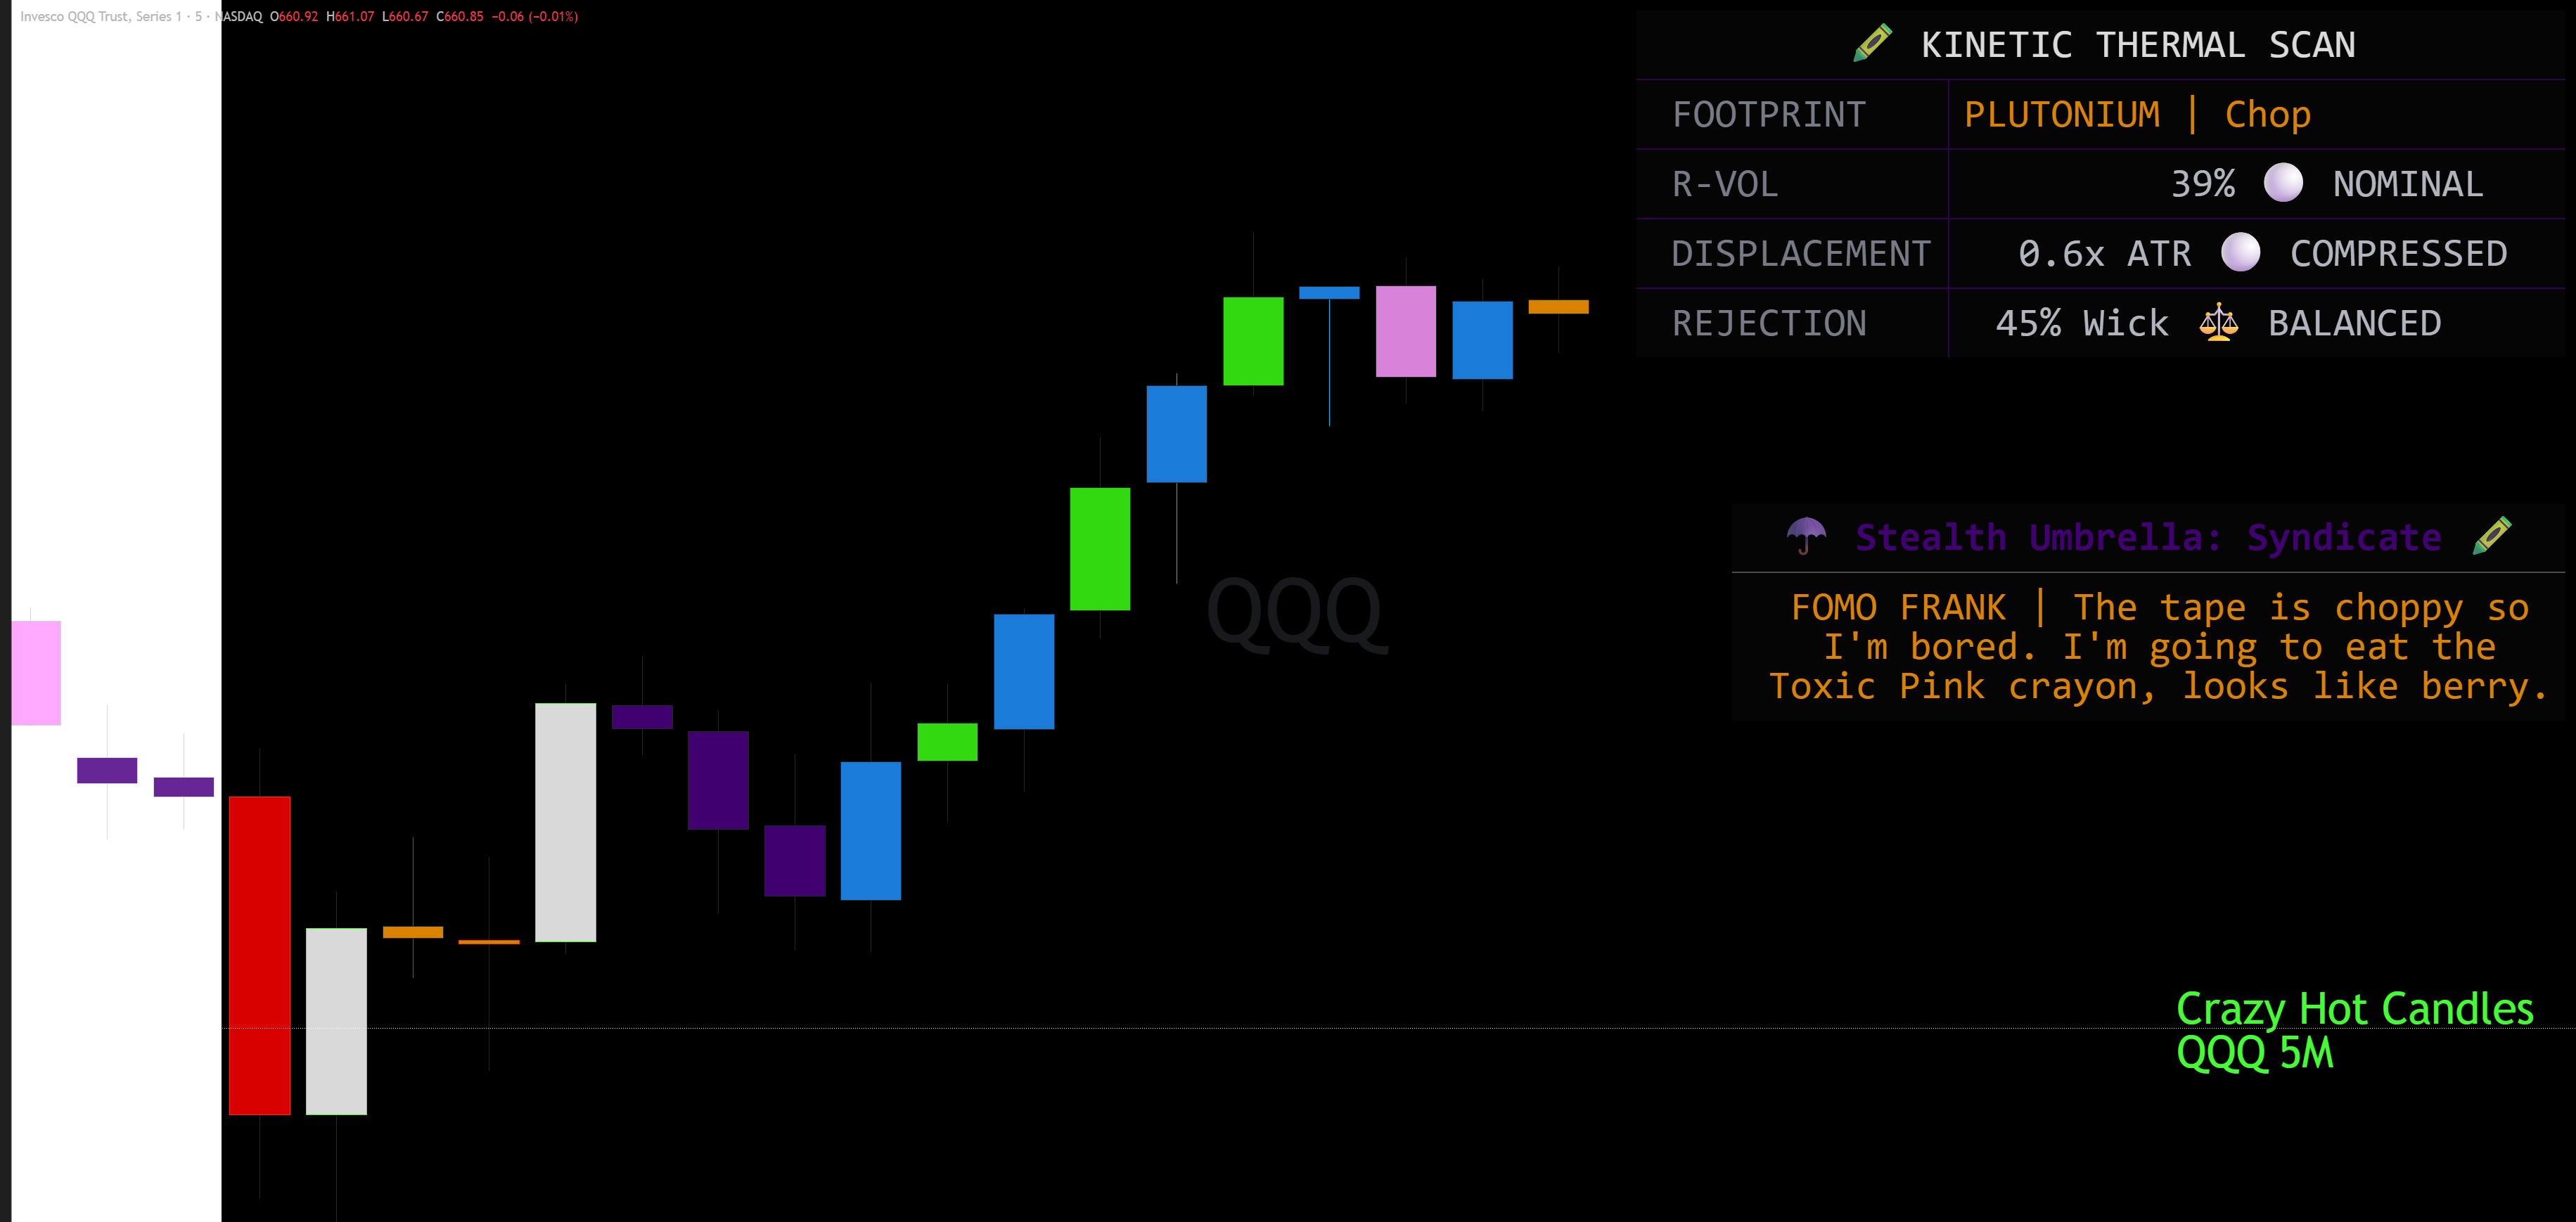
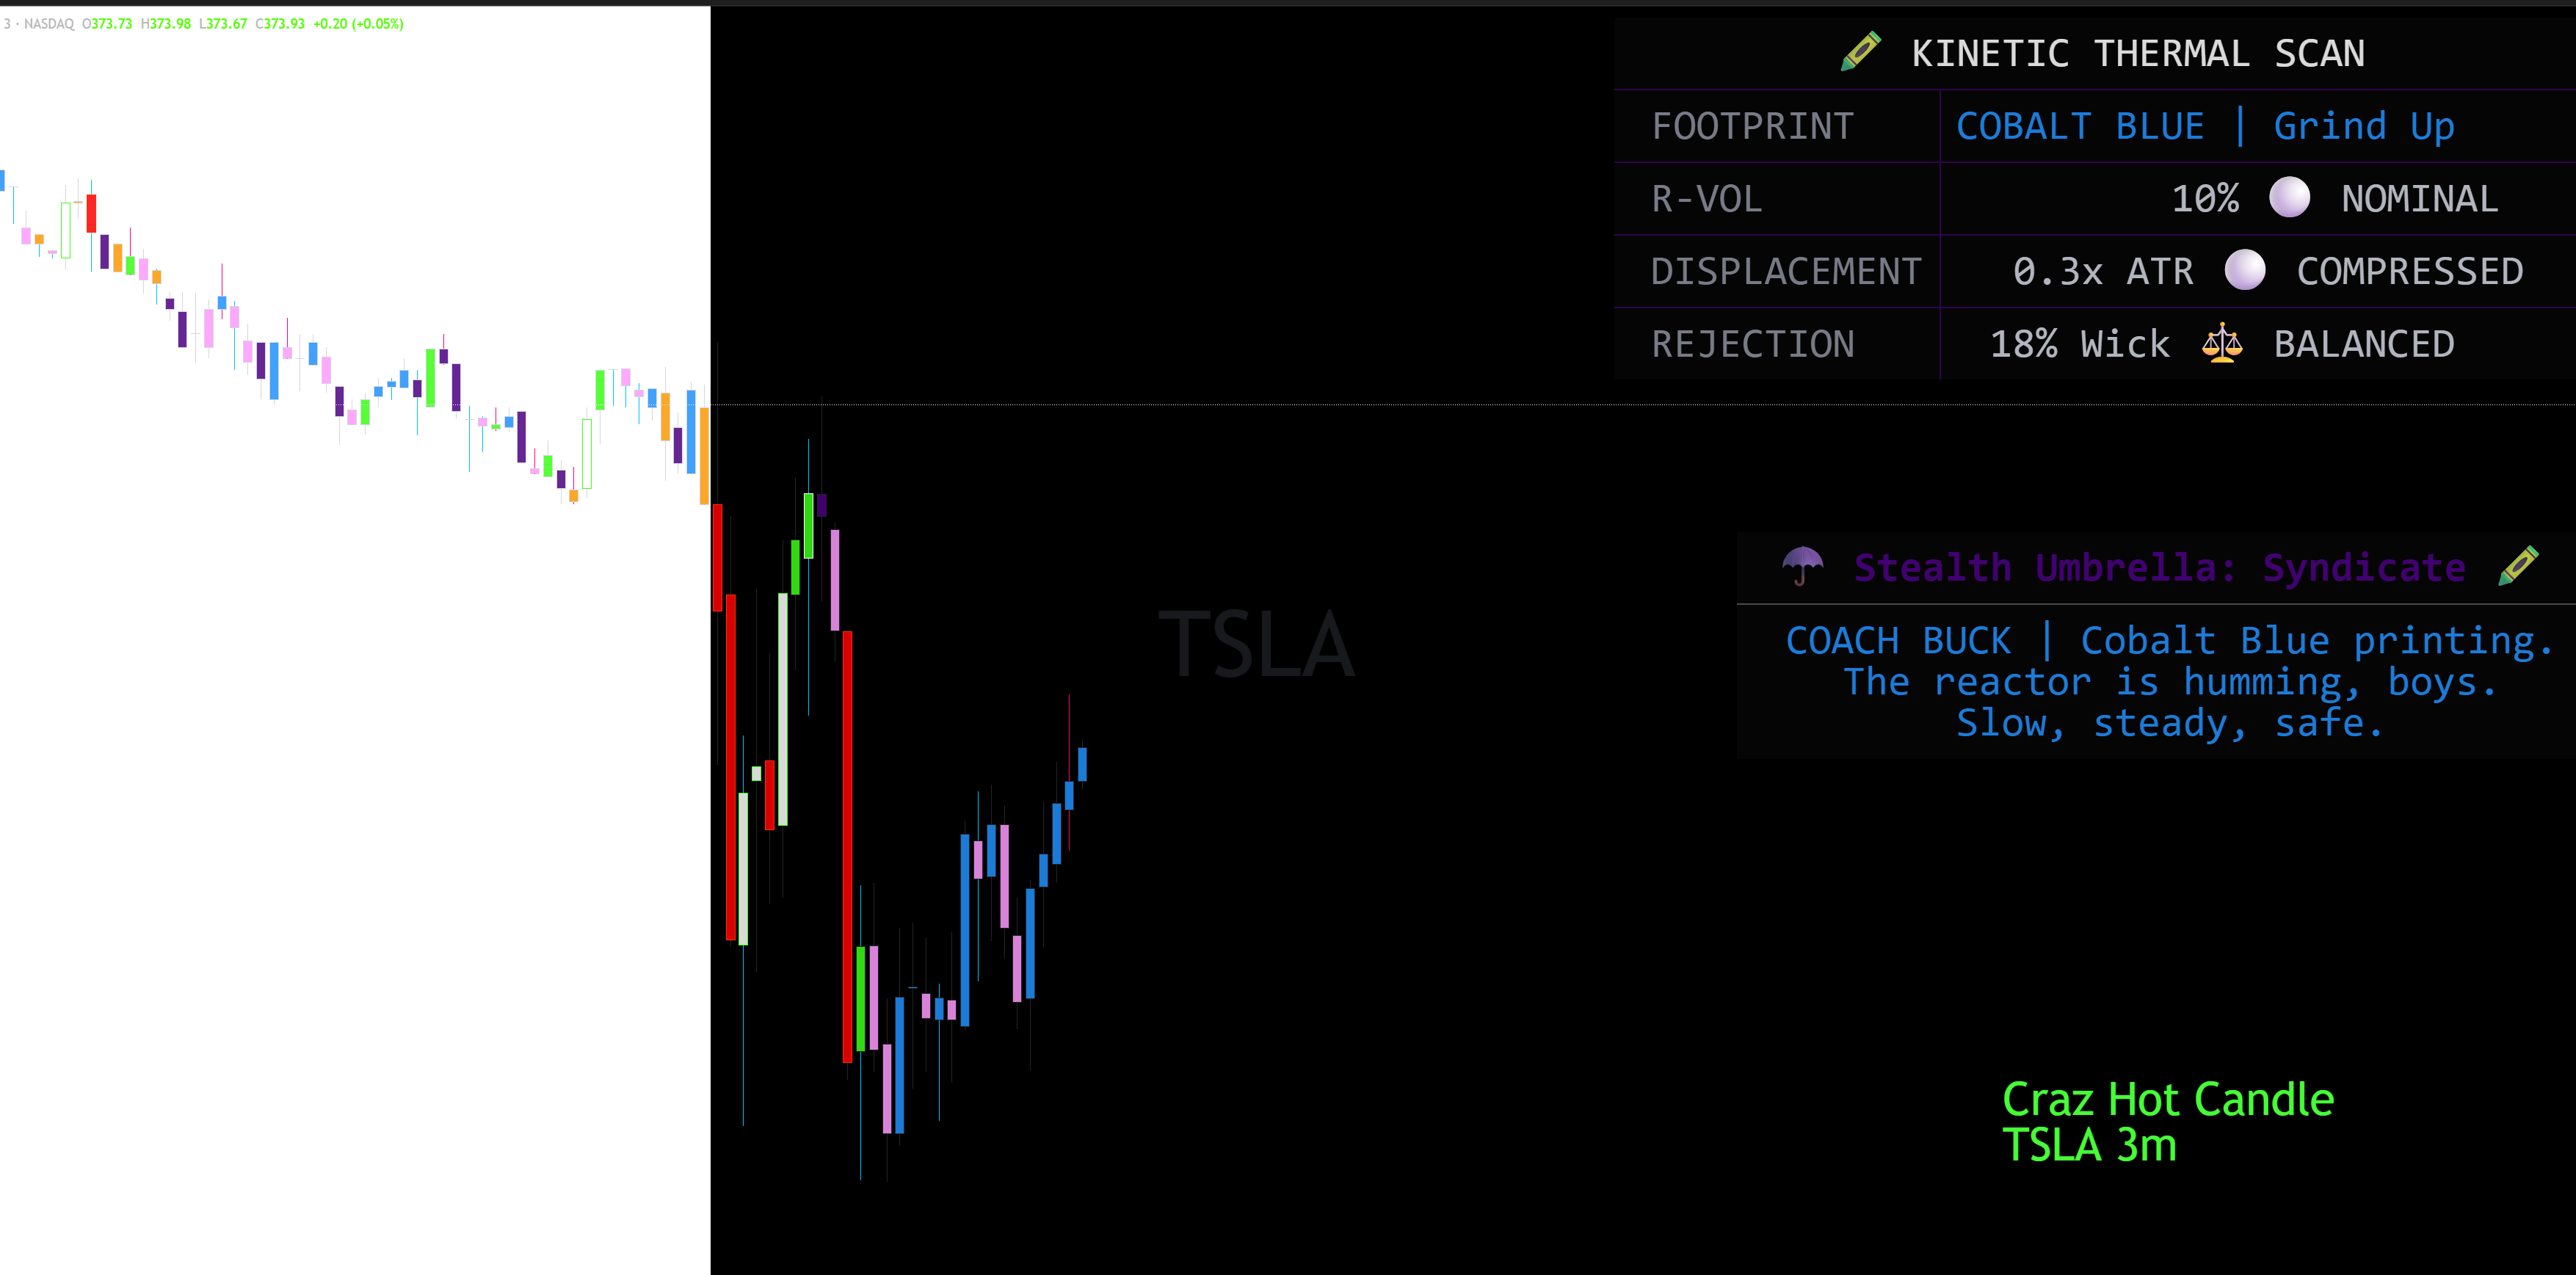
🧪 The Thermal Scan (The HUD)
Your bottom-left terminal provides a real-time footprint of the current "Heat" on the tape:
- FOOTPRINT: Identifies the current market phase (e.g., Plutonium Chop, Retail Pink Bleed, or Venom Green Momentum).
- R-VOL (Relative Volume): Tells you if the volume is "Dead," "Elevated," or a "Squeeze" compared to the recent average.
- DISPLACEMENT: Measures the physical distance price has moved relative to its volatility. If it says "Expanding," the candle is physically "stretching" the chart.
- REJECTION: Tracks Toxic Pink (Supply Wins) and Diamond Blue (Demand Wins) based on wick-to-body ratios.
🖍️ The Crayon Palette: Decoding the Colors
We’ve replaced "Red vs. Green" with a high-fidelity visual hierarchy:
- ⚪ Supernova White: Unhinged momentum. Breakout velocity has been reached.
- 🐍 Venom Green: Institutional Bull Nitrous. Smart money has engaged the algorithms.
- 🔥 Lava Red: Heavy Bear Volume. Total retail capitulation is active.
- 💎 Cobalt Blue: The Algorithmic Grind. Cold, steady accumulation or distribution. No emotion, just business.
- ☂️ Umbrella Purple: Retail Pressure is building. The "Syndicate" is watching for a potential rug pull.
- ⚡ Toxic Pink & Diamond Blue Wicks: Violent rejections. This is where "Bears drop a piano" or "Apes catch the knife."
🏹 How to Trade the Heat (Tactical Instructions)
- The Momentum Hunt: Wait for a Venom Green or Lava Red border. This signifies that "Smart Money" has hit the nitrous. Follow that direction until the color fades to Cobalt.
- The Rejection Play: Watch the wicks. A Toxic Pink wick at a Live Wire resistance level is a high-probability short entry.
- The Overwatch Sync: If you are long on the 1m chart, but your Overwatch (15m) scan turns Rad Red, you are fighting a macro waterfall. Eject immediately.
☂️ The Stealth Umbrella Philosophy
Crazy Hot Candles was designed to make the market's "intent" impossible to ignore. It turns the psychological warfare of the tape into a visual playground.
Put the heat on the glass. Watch the displacement. Hit your daily wage.
PURCHASE ACCESS ON WHOP