Stop trading in the dark. You need to know where the walls are.
Most retail traders get crushed because they suffer from tunnel vision. They stare at the 1-minute chart, see a massive green candle, and buy the breakout—only to get instantly rejected and liquidated. Why? Because they couldn't see the macro institutional level hovering right above their heads. They shot blindly into a brick wall.
Welcome to Live Wires. This is your structural map of the battlefield.
🧱 What Are Live Wires?
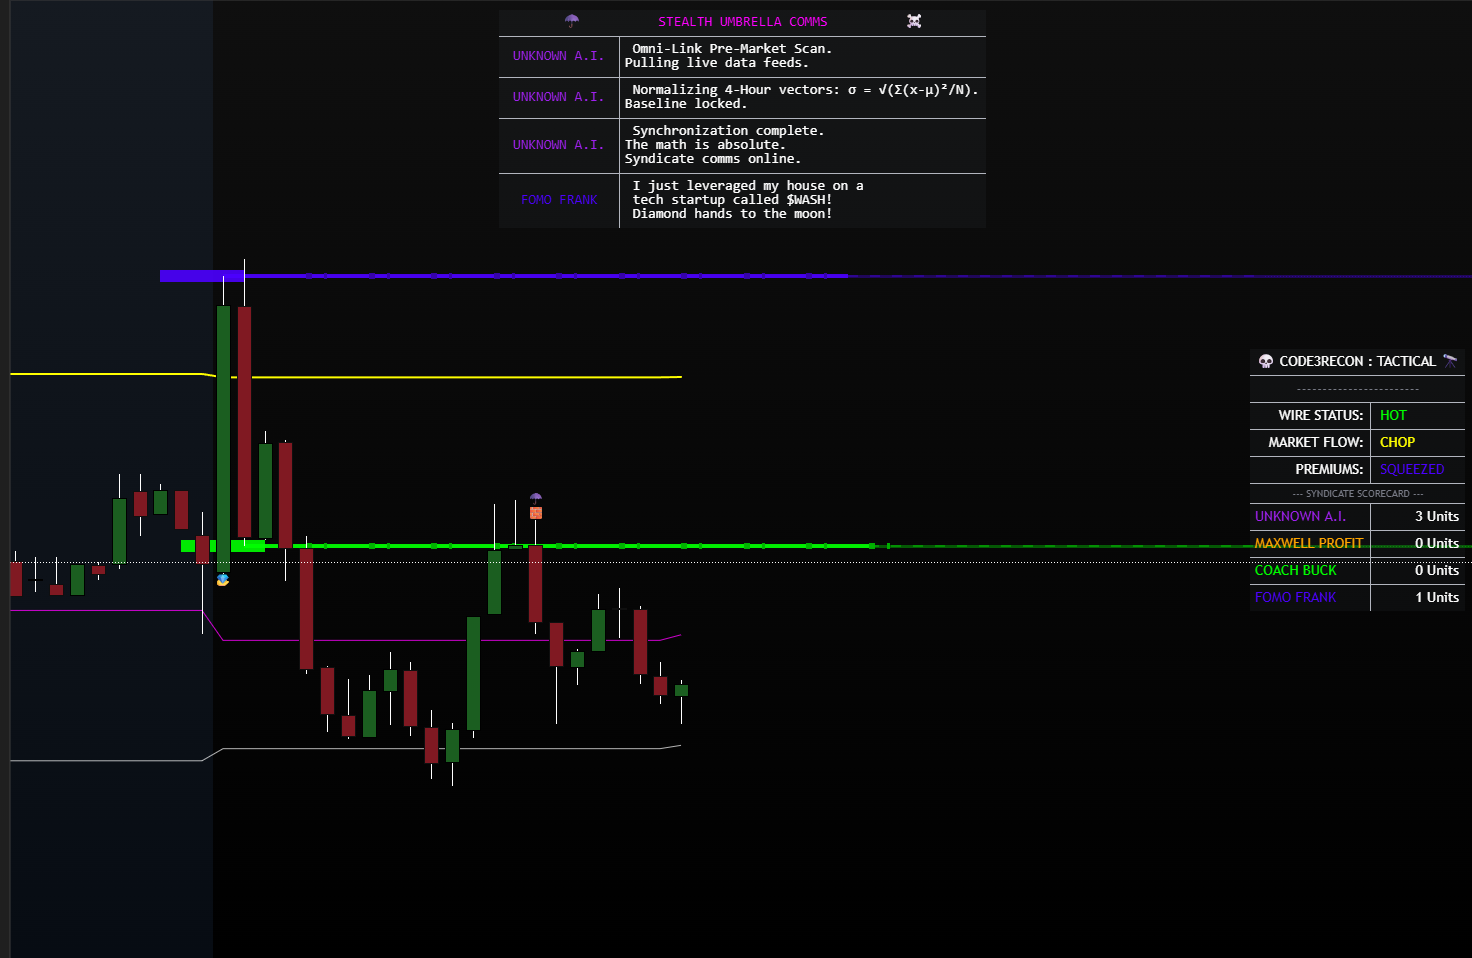
Live Wires are dynamic, high-timeframe institutional levels pulled directly onto your intraday glass. We’ve coded this tool to automatically identify and plot the massive daily, weekly, and macro liquidity zones so you don't have to manually draw lines every morning.
- The Brick Walls: These lines represent the heavy support and resistance zones where market makers are defending their positions.
- The Magnetic Pull: Price is drawn to liquidity. Live Wires show you the exact targets the market is trying to reach, allowing you to ride the magnetic pull from one wire to the next.
⚡️ How to Trade the Wires
Live Wires give context to the intraday chop. Once they are on your glass, your entire trading plan simplifies into two distinct reactions:
- The Rejection (The Wall): When price approaches a massive Live Wire, expect a fight. If the momentum dies as it hits the wire, it is a high-probability reversal zone. We use these levels to take profits and look for the bounce.
- The Break (The Void): If institutional volume shatters a Live Wire, the wall is broken. The price will aggressively seek the next Live Wire. This is where we catch massive, fast-moving trend days.
🛡️ The Ultimate Filter
Live Wires are the foundation of the Stealth Umbrella ecosystem. They are the ultimate filter for your trades.
If your other indicators—like Hector’s Hunt or standard moving averages—tell you to buy, but you are sitting right underneath a heavy red Live Wire... we stay under the umbrella. We do not trade into the wall. We wait for the break, or we wait for the rejection.
🤖 The Data Pipeline
We didn’t just guess where these levels are. We fed historical institutional order flow and macro structure data into our indicator models to find the exact zones that actually matter. It’s cold, calculated math.
Don't wander the maze blind. Put the boundaries on the glass, hit your daily wage, and get off the screen. The grid is live.
☂️ The Stealth Umbrella Philosophy
Stop shooting blindly into brick walls. Map the battlefield and let the math guide your execution.
PURCHASE ACCESS ON WHOP